Learning objectives
Learning objectives
- Review: What is split-apply-combine and why it is useful?
Learning objectives
- Review: What is split-apply-combine and why it is useful?
- Learn: How to do split-apply-combine using
dplyrfunctionsgroup_by()andsummarise().
Learning objectives
- Review: What is split-apply-combine and why it is useful?
- Learn: How to do split-apply-combine using
dplyrfunctionsgroup_by()andsummarise().
- Apply: Use
group_by()andsummarise()to effectively summarise data.
Review
Review
60 second task
What do you think of when you hear the phrase "split-apply-combine"?
Review
60 second task
What do you think of when you hear the phrase "split-apply-combine"?
*
*
Review
What is split-apply-combine?
Review
What is split-apply-combine?
- Split the data into groups based on some criteria.

Review
What is split-apply-combine?
Split the data into groups based on some criteria.
Apply a function to each group independently.

Review
What is split-apply-combine?
Split the data into different groups.
Apply a function to each group independently.
Combine the results into a data structure.

Review
What is split-apply-combine?
Split the data into different groups.
Apply a function to each group independently.
Combine the results into a data structure.
So how do we do this with dplyr?
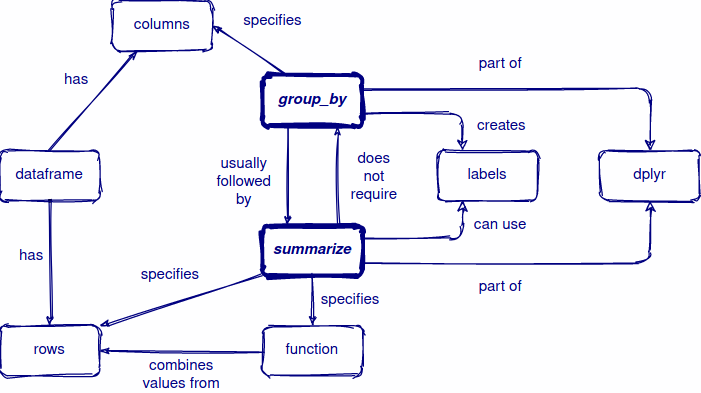
Split-apply-combine with the dplyr package
Split-apply-combine with the dplyr package
- Split:
group_by()
Split-apply-combine with the dplyr package
Split:
group_by()Apply & combine:
summarise()
Split-apply-combine with the dplyr package
Split:
group_by()Apply & combine:
summarise()We can link these commands together using the "pipe" operator:
%>%
Split-apply-combine with the dplyr package
Split:
group_by()Apply & combine:
summarise()We can link these commands together using the "pipe" operator:
%>%
All together, this looks like:
Split-apply-combine with the dplyr package
Split:
group_by()Apply & combine:
summarise()We can link these commands together using the "pipe" operator:
%>%
All together, this looks like:
data %>%
group_by() %>%
summarise()
Split-apply-combine with the dplyr package
Split:
group_by()Apply & combine:
summarise()We can link these commands together using the "pipe" operator:
%>%
All together, this looks like:
data %>%
group_by(group1, group2, ...) %>%
summarise(summary_column1 = summary_function1(...), ...)
Split-apply-combine with the dplyr package
Split:
group_by()Apply & combine:
summarise()We can link these commands together using the "pipe" operator:
%>%
All together, this looks like:
data %>%
group_by(group1, group2, ...) %>%
summarise(summary_column1 = summary_function1(...), ...)
Let's try with some real data!
library(palmerpenguins)library(dplyr)glimpse(penguins)## Rows: 344## Columns: 8## $ species <fct> Adelie, Adelie, Adelie, Adelie, Adelie, Adelie, Ade…## $ island <fct> Torgersen, Torgersen, Torgersen, Torgersen, Torgers…## $ bill_length_mm <dbl> 39.1, 39.5, 40.3, NA, 36.7, 39.3, 38.9, 39.2, 34.1,…## $ bill_depth_mm <dbl> 18.7, 17.4, 18.0, NA, 19.3, 20.6, 17.8, 19.6, 18.1,…## $ flipper_length_mm <int> 181, 186, 195, NA, 193, 190, 181, 195, 193, 190, 18…## $ body_mass_g <int> 3750, 3800, 3250, NA, 3450, 3650, 3625, 4675, 3475,…## $ sex <fct> male, female, female, NA, female, male, female, mal…## $ year <int> 2007, 2007, 2007, 2007, 2007, 2007, 2007, 2007, 200…Examples
Examples
Our data contain three species of penguins.
Goal: We want to gather some summary statistics about the different species.
Examples
Our data contain three species of penguins.
Goal: We want to gather some summary statistics about the different species.
Count the number of penguins in each species...
penguins %>%
  group_by(species) %>%
  summarise(count = n())
What do you expect the output to look like?
## # A tibble: 3 x 2## species count## <fct> <int>## 1 Adelie 152## 2 Chinstrap 68## 3 Gentoo 124Also add a column for the mean bill length...
penguins %>%
  group_by(species) %>%
  summarise(count = n(),
            mean_bill_length = mean(bill_length_mm))
## # A tibble: 3 x 3## species count mean_bill_length## <fct> <int> <dbl>## 1 Adelie 152 NA ## 2 Chinstrap 68 48.8## 3 Gentoo 124 NAOh no! NA's!
Example with NA's
Example with NA's
Live example
Example with NA's
Because our data contains NA's, we have to let R know we want to ignore these values and still calculate the mean for the values we do have.
Example with NA's
Because our data contains NA's, we have to let R know we want to ignore these values and still calculate the mean for the values we do have.
penguins %>%
  group_by(species) %>%
  summarise(count = n(),
            mean_bill_length = mean(bill_length_mm,
                                    na.rm = TRUE))
## # A tibble: 3 x 3## species count mean_bill_length## <fct> <int> <dbl>## 1 Adelie 152 38.8## 2 Chinstrap 68 48.8## 3 Gentoo 124 47.5Example with NA's
Because our data contains NA's, we have to let R know we want to ignore these values and still calculate the mean for the values we do have.
penguins %>%
  group_by(species) %>%
  summarise(count = n(),
            mean_bill_length = mean(bill_length_mm,
                                    na.rm = TRUE))
## # A tibble: 3 x 3## species count mean_bill_length## <fct> <int> <dbl>## 1 Adelie 152 38.8## 2 Chinstrap 68 48.8## 3 Gentoo 124 47.5Much better!
Summary
Today, you have:
Summary
Today, you have:
- Reviewed the split-apply-combine workflow for summarising data.
Summary
Today, you have:
Reviewed the split-apply-combine workflow for summarising data.
Learnt how to use
group_byandsummarise.
Summary
Today, you have:
Reviewed the split-apply-combine workflow for summarising data.
Learnt how to use
group_byandsummarise.Applied your knowledge to some example problems concerning penguins.
Summary
Today, you have:
Reviewed the split-apply-combine workflow for summarising data.
Learnt how to use
group_byandsummarise.Applied your knowledge to some example problems concerning penguins.
Good job!
More resources
An introduction to data manipulation with
dplyrfrom the carpentries.Another split-apply-combind tutorial with
dplyr.R for data science book for more on this topic and many other related concepts.